Debugging weird memory glitches
7 min read
This is a technical post. We originally posted this in Bluesky as a thread some months ago. I decided to rewrite it here as a fuller post. We are using Unreal Engine 5.7 to make our game and so, the technical findings below might not apply to future versions of the engine.
While playtesting AGENCY within Steam, I kept encountering a crash that we did not see while playing the game within the Unreal Editor. It was a non-deterministic bug and I could not easily reproduce it. Since the playtest build on Steam was compiled in production mode, without any debugging symbols, there were no stack traces to help figure out the causes.
After enough crashes, we observed that it always happened in response to a key press to trigger an in-game event, an event that destroys a visible object in the level. Unlike regular C++ programs, Unreal features a garbage collector (GC) that is used for most things and it is responsible for automatically reclaiming the memory used by destroyed objects. Since the crash seemed correlated with an object being destroyed, I suspected that the GC was somehow involved in this.
I tried a simple test. I created a timer to automatically create and destroy the
object repeatedly. I also enabled the flag gc.CollectGarbageEveryFrame 1 via
the console, to force the garbage collector to run every frame. Without this
flag, it would run on its own schedule and it would make the bug hunting more
difficult due to the non-determinism.
This test did not reproduce the crash. I wondered if the key press to trigger the event was somehow involved in the crash. I re-ran the test and I repeatedly pressed the key while the test was running. Eventually, Visual Studio complained about a null pointer access and gave me a stack trace. Success! However, the stack trace seemed awfully weird, making it look like the bug was somewhere deep in the engine. I just dismissed it and repeated the test all over again and went for about 10 minutes without reproducing anything.
To save my fingers, I modified the test and added another timer to repeatedly trigger the key press. This ended up being easier than I expected thanks to the use of the EnhancedInput subsystem. Eventually, I had another crash and this time, I examined the stack trace more closely. It still looked like a crash in the middle of the engine but it was somehow triggered by this piece of code:
if (IsValid(CurrentInteractable))
{
    IWInteractable::Execute_EndInteract(CurrentInteractable, GetOwner(), false);
    CurrentInteractable = nullptr;
}
A quick explanation: the IsValid() call checks if CurrentInteractable points
to a valid object that is not being garbage collected. If so, an interface
function EndInteract() is called on CurrentInteractable (which is an object
that implements the interface IWInteractable).
At this point, I should point out that CurrentInteractable is an instance
variable declared as a raw pointer, like so:
ASomeObject* CurrentInteractable;A different way of declaring the pointer, as you might see in various tutorials or example projects, is this:
UPROPERTY()
TObjectPtr<ASomeObject> CurrentInteractable;
One is often told or given the impression that the latter approach is better if
the lifecycle of the object is managed by the engine, which is the case unless
one is doing something particularly different or advanced. But when we were
writing this piece of code, we were not as familiar with the engine as we are
now, and using TObjectPtr or not just seemed like a detail to us.
Going back to the problem, despite the use of IsValid(), the EndInteract
call failed, resulting in a crash with a weird stack trace. Presumably this
meant that CurrentInteractable was pointing to some invalid area of memory.
But if so, why did IsValid() return true?
This had the appearance of a race condition so that was the first theory. It is
possible that IsValid() returned true because CurrentInteractable was really
valid at that moment, but before the next line of code could run, maybe Unreal’s
garbage collector cleared CurrentInteractable.
This theory does not make sense though. Based on my searches, the GC is supposed
to be synchronous, at least the part that cleans up an object. It is not
supposed to run in parallel with the game code to reclaim memory. At the same
time, nothing should have interrupted the game code, in the middle of the
function call, to run the GC code. So if the object was truly valid at the time
it was passed to IsValid(), the object should remain valid within the if
statement block.
The next theory was that maybe IsValid() was unreliable but this did not make
sense either. It has a straightforward implementation: check if the pointer is
not a nullptr and check that the object does not have the “garbage” flag set
on it. Here’s a screenshot that shows the memory view from the debugger when
CurrentInteractable is marked for garbage collection:
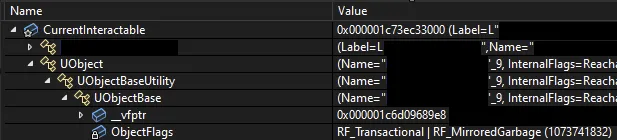
We censored parts of the screenshot above so as to not spoil the game 😃 . The
important piece in this screenshot is the field ObjectFlags, which shows that
the object has the flag RF_MirroredGarbage. The IsValid() check looks for
this and in this particular scenario, it will return false. It was difficult to
find an issue with this simple implementation of IsValid() so I moved on to
finding other causes.
This was when I learned that Unreal’s memory allocators have custom memory pooling behavior. When the GC destroys an object to reclaim memory, the allocator merely marks the memory previously used by the object as free within its own internal memory pools. If something else in the game requires memory, the allocator has the freedom to hand out the memory that was just used by the destroyed object. In this approach, the allocator does not involve the OS at all, which is a classic thing to do for performance reasons. Involving the OS has a cost and relying on the OS for every single memory allocation and free operation will result in a slower engine.
Given this behaviour, it is possible that the CurrentInteractable object has
already been destroyed, and the underlying memory reclaimed and reused for
something else, by the time this IsValid() check runs. In this scenario,
CurrentInteractable is a dangling pointer, pointing to some unknown area in
memory. It might not even be pointing to the beginning of some other object.
When passing this pointer to IsValid(), the check will interpret that area of
memory to check if the garbage flags are set but these results should not be
trusted because the pointer itself is invalid. Who knows what IsValid() is
looking at? It may well be accessing the middle of some string or integer
variable to read the object’s flags. If it happens to return true and the
interface method runs, a crash should be expected because the interface method
is being executed in some random area of memory, and not on an object that
implements the IWInteractable interface. This should also explain the weird
stack trace.
This new theory fit the observations quite well so it was time to prove it. If I
repeated the test as-is, I would just get a crash. But what I needed was to
examine CurrentInteractable before IsValid() runs, to find the case where
CurrentInteractable is a dangling pointer. If CurrentInteractable is a valid
object, then both its “label” and “name” attributes should also be valid. To
find the dangling pointer then, I added a conditional breakpoint to break when
either of those attributes are invalid and then re-ran the test. Here’s the view
from the debugger when the breakpoint eventually hit:

The object’s “label” and “name” attributes are both invalid and the
ObjectFlags field does not contain any garbage flags. This looks very much
like a dangling pointer. I allowed the IsValid() line to run and sure enough,
it returned true. I also allowed the next line to run, to execute the interface
method and yep, a crash occurred with a weird stack trace. The new theory seems
to be correct.
To understand how to fix this, I went back to the documentation to read about
TObjectPtr and how it interacts with the GC. It turns out that we get some
assistance from the engine when we use this approach of declaring pointers.
UPROPERTY()
TObjectPtr<ASomeObject> CurrentInteractable;
In this snippet, UPROPERTY() is a C++ macro specific to Unreal. In conjunction
with TObjectPtr, it prevents the GC from reclaiming (and reusing) memory
belonging to CurrentInteractable until it has been manually set to nullptrhttps://dev.epicgames.com/community/learning/knowledge-base/ePKR/unreal-engine-garbage-collector-internals.
That is, some code somewhere must explicitly do this
CurrentInteractable = nullptr;before the GC is allowed to reclaim the memory previously used by
CurrentInteractable. However, the GC will still mark destroyed objects with
the garbage flag. This eliminates the scenario where CurrentInteractable
becomes a dangling pointer and it also means IsValid() will work properly when
reading the flags.
Another option is to use TWeakObjectPtr, which allows the GC to automatically
nullify memory references when it reclaims memory from destroyed objectshttps://dev.epicgames.com/documentation/unreal-engine/object-pointers-in-unreal-engine.
Ultimately, I ended up using TObjectPtr and updated our code to nullify
references manually. With this fix in place, we could not reproduce the crash
anymore. We also went ahead and cleaned up the rest of the project to
consistently use TObjectPtr when declaring instance variable pointers to
objects by using ripgrep. Finally, we enabled the following option in our
build.cs file to generate compile errors when using raw pointers in instance
variables.
NativePointerMemberBehaviorOverride = PointerMemberBehavior.Disallow;Sometimes, especially when in a time crunch, the only thing a person can do is
to implement a suggested fix, like using TObjectPtr, without knowing why it
works. But it was nice to take the time here to actually understand what is
going on with a bug and find out why a proposed fix actually fixes things.